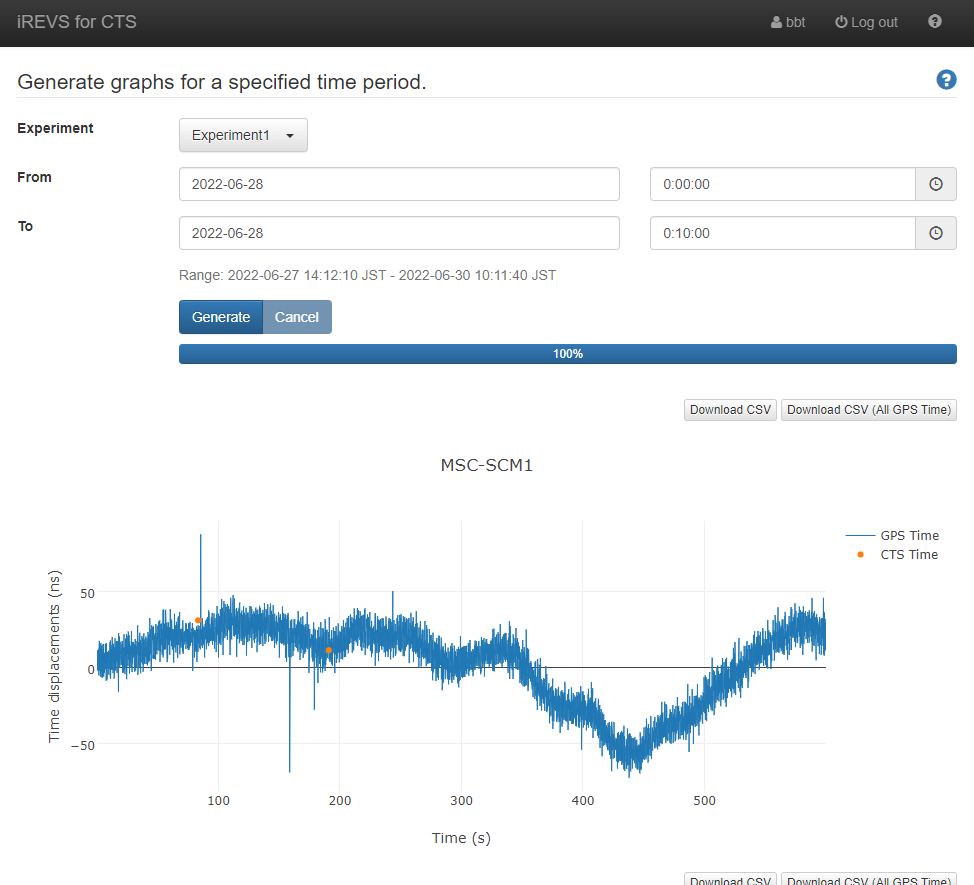
This page can generates the CTS Time and GPS Time graphs by specifying the experiment and the time period.
The graph can be downloaded as a csv file by clicking on the button in the upper right corner of the graph.
If you don't belong to the experimental group, you cannot use the Muogram generator.
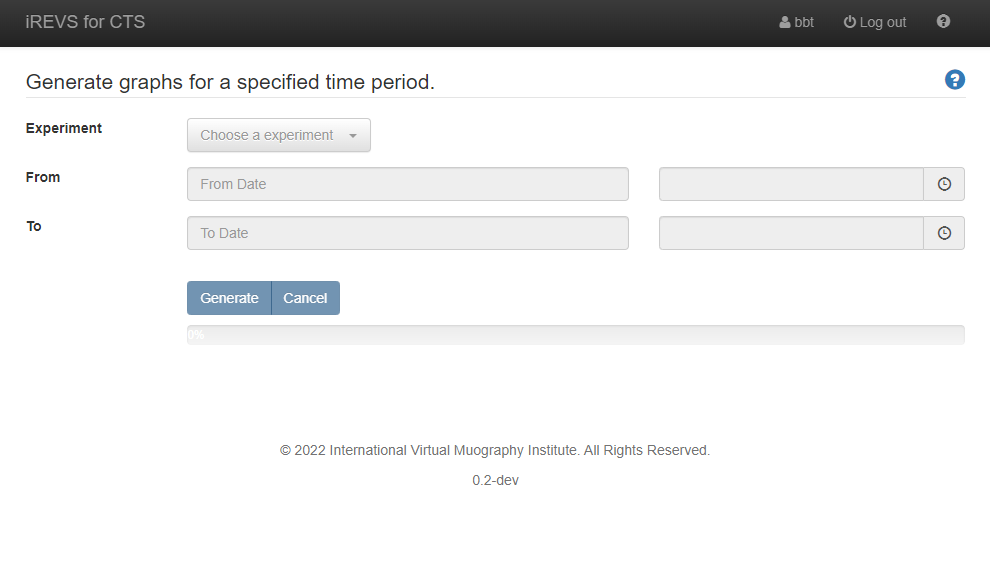
How to generate graphs and download csv files
- Select the experiment in [Experiment] pull-down menu.
- Select start and end time in [From], [To] pull-down menu.
-
Click [Generate] button to generate graphs.
- If the [Cancel] button is clicked during graph generation, the process is aborted.
- Click [Download CSV] or [Download CSV (All GPS Time)] button to download csv files.
- [Download CSV] : Download a csv containing all CTS Time data and contemporaneous GPS Time.
- [Download CSV (All GPS Time)] : Download a csv containing all GPS Time and CTS Time data displayed in the graph.